A model under development by Embrapa was able to accurately estimate sugarcane productivity using satellite images collected during the crop's growth phase. The results were obtained by integrating the images with statistical techniques and machine learning. The same methodology was also tested on soybeans and served as a validation tool for the recently launched biostimulant Hydratus.
The research uses a time series of PlanetScope images made available through the Brasil Mais Program, run by the Ministry of Justice and Public Security. The daily images allow researchers to identify the best moments in plant development to obtain the vegetation index used in the forecast. The information collected from the images, combined with variables such as cultivar, production cycle, and accumulated precipitation during the growth phase, is used in a prediction model.
In the case of sugarcane, a study conducted in partnership with the Cooperative of Sugarcane Planters of the State of São Paulo (Coplacana), and funded by Finep, monitored two harvests over three years and obtained a coefficient of determination of 0.89. This means that when comparing the model's predictions with the yield observed in the field using traditional agronomic methods, there was an accuracy of 89%, a rate considered high for forecasting.

Photo: Geraldo Magela (experimental area)
Embrapa Digital Agriculture researcher Geraldo Magela Cançado explains that the work began with a simpler model, but as the work progresses, new variables will be added, such as temperature, soil texture, and water availability. These variables are expected to improve the tool's efficiency.
The research team hopes to generate a prediction model that can be used by producers and industry with data per plot on rural properties. This would enable better strategic planning, negotiation anticipation, logistics scheduling, and guidance for potential crop interventions.
Another possible use would be for government agencies to forecast crops. "This methodology allows for a more objective harvest survey. We want to reduce the subjectivity of this forecast and be more comprehensive. Considering the vastness of this country, this is only possible with the use of satellite imagery," says researcher João Antunes.
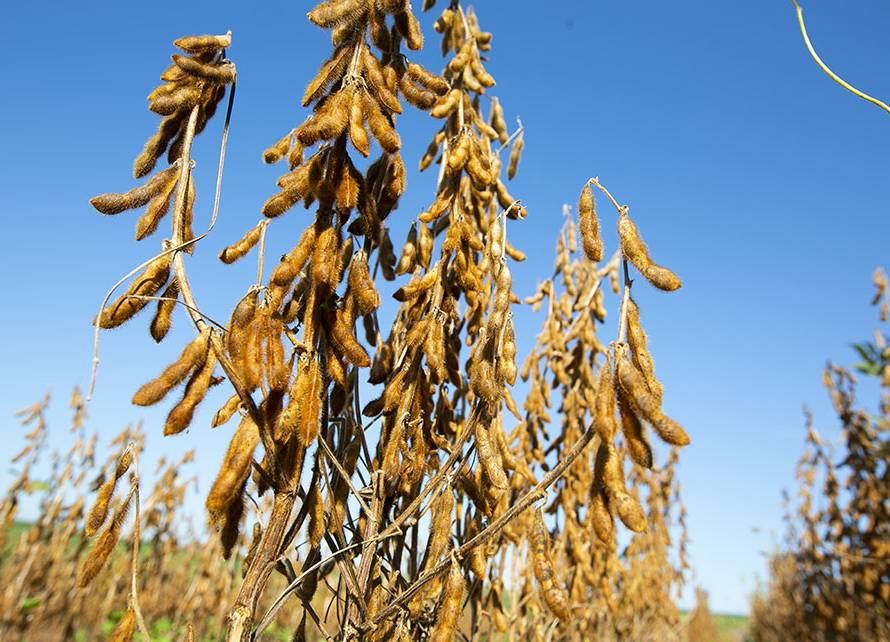
In soybean cultivation
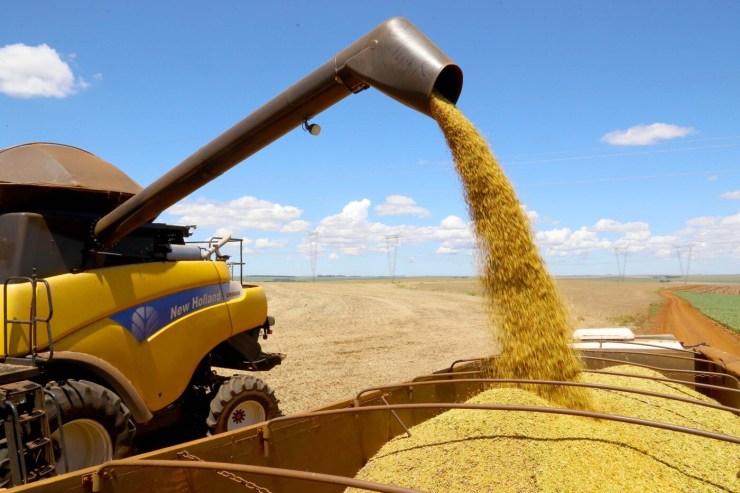
After the initial experiment with sugarcane, the same methodology began to be used in soybean crops in a study validating the use of the biostimulant Hydratus, which protects plants against drought and stimulates plant growth. The study, funded by Finep (National Institute of Agriculture, Livestock and Supply), was conducted in partnership with Embrapa Milho e Sorgo (Milking and Sorghum) and the company Bioma. Three areas were monitored. In two of them, the research team used PlanetScope satellite imagery, and in the third, images captured using a drone.
While the green normalized difference vegetative index (GNDVI) was used to predict yield for sugarcane, the enhanced vegetation index (EVI2) was used for soybeans. The former uses near-infrared (NIR) and green spectral bands, allowing for the identification of differences in chlorophyll content. The latter uses the red spectral band in addition to NIR, with sensitivity to plant structure and biomass.
 The results not only revealed a difference in productivity between treatments with different doses and the control of the biostimulant Hydratus, but also showed a correlation of 71% between predicted and observed productivity. Although lower than the accuracy of sugarcane, the model's prediction index is considered high. "Each crop behaves differently, and this variation between them is normal. In general, we assume correlation levels above 0.6 are acceptable (i.e., the model can explain more than 60% of the observed variation). In the case of sugarcane, since production is closely linked to the plant canopy itself (the part of the plant above the soil surface, formed by leaves and stalks), better results are obtained, as there is a nearly direct relationship between biomass and stalk productivity (a typical stem of grasses, such as sugarcane). In the case of soybeans, since the product is the grain, the relationship between soybean canopy and productivity is not so direct," explains Geraldo Cançado.
The predictive model's positive results raise optimism for its use in field research, enabling accurate, non-destructive monitoring. "This dual assessment framework, combining agronomic metrics with remote sensing, provides an innovative and cost-effective strategy for assessing crop performance in real time," the researcher states.
The study compares two approaches: one with machine learning and the other with statistical methods. According to Embrapa analyst Eduardo Speranza, due to the still small sample size used to train the algorithm, the statistical model has proven more accurate. "Despite having many experiments, we worked on a publication with 500-600 samples to train an algorithm. This is a small amount for machine learning. The machine learning method has the potential to be better, but it requires thousands of samples," explains Speranza, noting that increasing the sample size depends on on-site validation using the agronomic monitoring method.