EN
EN  PT_BR
PT_BR Brazilian pork exports in nature Until June 2025, month by month, shipments significantly exceeded those of the same period in 2024. In July 2025, for the first time this year, there was a decrease compared to last year, which did not persist in August (Table 1). Despite this decline, the accumulated total for the year (January to August 2025) is almost 13% (96,700 tons) more than in 2024. In the partial data for September 2025, with shipment data up to the 12th, 63,400 tons of Brazilian pork have already been exported. in natureThis represents a 23.6% increase in daily volume compared to September 2024, indicating that this month will most likely see a new monthly export record, approaching 130,000 tons.

Table 1. Export volumes of fresh Brazilian pork (in tons), month by month, in 2021, 2022, 2023, 2024 and from January to August 2025. Prepared by Iuri P. Machado, with data from Secex.
The Philippines continue to lead our exports, and China, although still occupying second place in the year-to-date figures (Table 2), has been significantly decreasing its purchases, with China and Hong Kong combined accounting for less than half the volume shipped to the Philippines in August 2025 (Table 3).

Table 2. Main destinations of Brazilian fresh pork exports in January and August 2025, compared to the same period in 2024, with value in US dollars (FOB). Order of countries established based on 2025 volumes. Prepared by Iuri P. Machado, with data from Secex.

Table 3. Brazilian exports of fresh pork by destination in AUGUST 2025 (in tons and in US$) compared to August 2024. Prepared by Iuri P. Machado, with data from Secex.
As shown in Table 4 below, the growth in Brazilian meat exports in 2025 is not limited to pork. Beef exports are far exceeding last year's volumes, and August 2025, despite the US tariffs, was the second-best month in terms of export volume in history, with more than 268,000 tons. in nature Shipments, even with the low volume imported by the US (just over 6,000 tons), represent a decrease of more than 50% compared to the previous month.
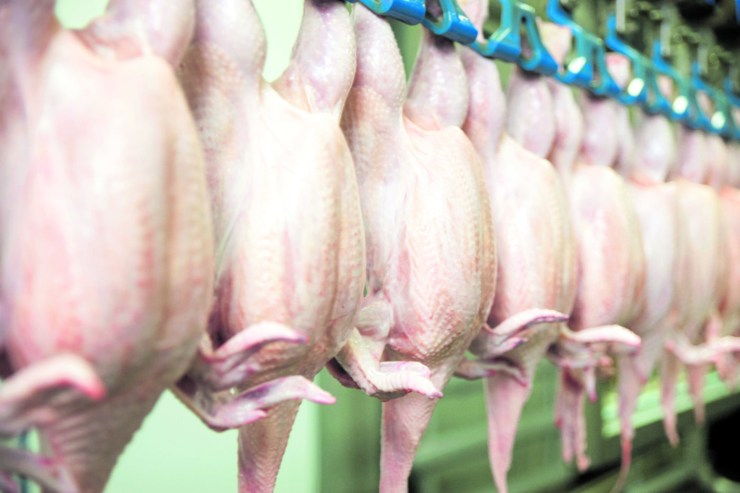
On the other hand, Brazilian poultry farming, which had experienced significant growth in exports in the first four months of the year compared to the same period in 2024, saw a significant reduction in shipments between May and July due to the outbreak of avian influenza in Rio Grande do Sul, reported in the first half of May. However, throughout July and August, importing countries gradually lifted their restrictions on purchases of Brazilian chicken meat. Among the countries that lifted their restrictions are: the United Arab Emirates, South Africa, the Philippines, Mexico, South Korea, and, more recently, the European Union. According to Mbagro, approximately 131% of the monthly volume that Brazil would export under normal circumstances is still suspended, such as exports to China, which represented 121% of the Brazilian chicken meat export market. Despite this drop in chicken exports, the three meats combined accumulated an increase of just over 5% (280,000 tons) between January and August 2025, compared to the same period last year.

Table 4. Brazilian exports of beef, chicken, pork, and the sum of the three, in natura, in tons, from January to August 2025, compared to the same period in 2024 and the previous period. Highlighted (in yellow) are the drops in chicken volumes from May to July 2025, due to the outbreak of avian influenza in Rio Grande do Sul, and the increase in the total sum of the three meats, with growth of 5.04% compared to the same period last year and 10.58% compared to the previous seven months. Prepared by Iuri P. Machado, with data from Secex.
Analyzing these export data for the three proteins and considering domestic availability, the reduction in chicken shipments was more than offset by the increase in beef and pork exports. In this context, with the gradual recovery of normal poultry meat shipment volumes in August, which continues in the first half of September (up to the 12th), the prices of chilled chicken carcasses, which plummeted in June 2025 in the São Paulo wholesale market (graph 1), show a significant recovery in September, especially in recent days (graph 2), following the reopening of the European Union.

Chart 1. Average monthly price of chilled chicken in São Paulo (SP), in R$/kg of carcass, over the last 12 months. Average from September to September 16, 2025. Source: CEPEA

Chart 2. Daily price of chilled chicken in São Paulo (SP), in R$/kg of carcass, over the last 30 working days, up to 09/16/2025. Source: CEPEA
Beef exports, which have surpassed last year's export volumes by almost 15%, also saw growth in slaughtering after experiencing a drop in carcass prices in July. Prices rose again in August and maintain an upward trend in September, after overcoming the threat of the "tariff hike" (graph 3). It is noteworthy that IBGE, in publishing the definitive slaughter data for the second quarter of 2025, showed that during this period, for the first time in the historical series, the slaughter of females exceeded that of males. Everything indicates that a cycle change is approaching, with a gradual reduction in the supply of cattle for slaughter and strong demand in domestic and international markets, which should keep prices firm for the remainder of the year.

As shown in graphs 4 and 5 below, pork prices (live and carcass) also fell in June and July, but recovered in August and September, showing that the market dynamics for pork going forward should be based predominantly on supply and demand, with the chicken and beef chains, which, as we saw earlier, are on an upward trend, helping to keep pork competitive, even with high prices.

Chart 4. Special Pork Carcass Indicator – CEPEA/ESALQ (R$/kg) in São Paulo/SP, monthly, over the last 12 months. Average from September 2025 to September 16, 2025. Source: CEPEA

Chart 5. Live Pig Indicator – CEPEA/ESALQ (R$/kg) in MG, PR, RS, SC and SP, daily, over the last 12 months. Prices shown in the chart refer to the month of September/25, up to 16/09. Source: CEPEA
IBGE released the final slaughter figures for the second quarter of 2025 and slaughter data by state for the first half of the year, highlighting the increase in Paraná, Rio Grande do Sul and Minas Gerais, when compared to the same period last year (table 5).

Table 5. Pig slaughter in the first HALF of 2025 by federative unit, compared to the same period last year. Highlighting the increase in Paraná, Rio Grande do Sul, and Minas Gerais (blue). Ranking established based on carcass tonnage in 2025. Prepared by Iuri P Machado using definitive data from IBGE.
With the start of planting for the Brazilian summer crop and the harvest of the American crop, expectations of a good supply of inputs remain.
Conab released the latest revision of the 2024/2025 crop forecast, adding almost 3 million tons of corn compared to the previous survey, totaling 139.7 million tons across the three national crops for the 2024/25 period. It's worth noting that the second crop (safrinha) has practically already been harvested, and planting of the summer crop (2025/26) of corn and soybeans has already begun in Brazil.
The United States Department of Agriculture (USDA), in a report published on the 12th, raised its estimates for soybean and corn production in the country, whose harvest begins in the coming weeks. The USDA estimated the soybean crop at 117.07 million tons, compared to the 116.82 million tons projected the previous month. For corn, the USDA increased its projection from 425.25 million to an impressive 427.08 million tons.
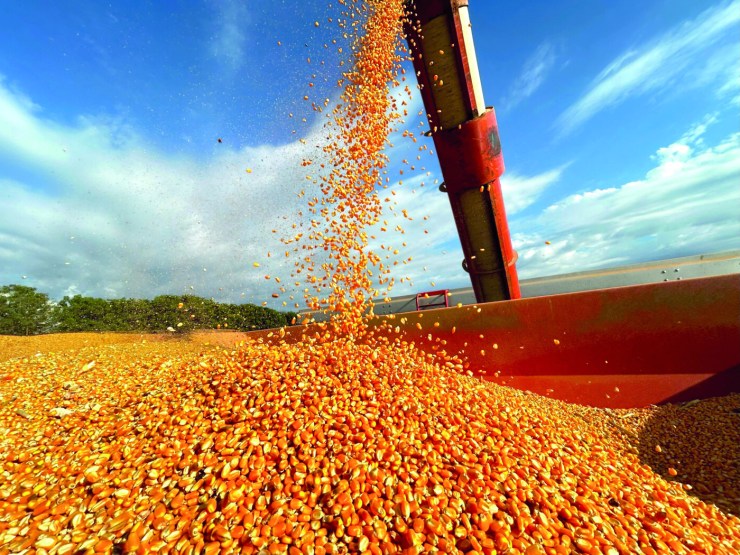
Even with a good supply in Brazil and expectations of a record North American harvest, corn prices in the domestic market have been rising gradually and consistently in recent weeks (graph 6), indicating that the lowest prices are behind us.

Chart 6. Average daily price of CORN (R$/SC 60kg) in CAMPINAS-SP, over the last 30 working days, up to September 17, 2025. Source: Cepea
Soybean meal also experienced a slight increase in most Brazilian markets. As pork prices saw consistent gains, even with the rise in key input costs, the terms of trade remain quite favorable (Figure 7).

Graph 7. Exchange ratio for SWINE: Corn + soybean meal MIX (R$/kg) in São Paulo, from August 2023 to August 2025. Ideal exchange ratio, above 5.00. MIX composition: for each kilogram of MIX, 740g of corn and 260g of soybean meal. Prepared by Iuri P. Machado with data from CEPEA – prices in the state of São Paulo.
Final considerations
The president of ABCS, Marcelo Lopes, explains that the chicken export market is gradually returning to pre-avian influenza levels in Rio Grande do Sul, contributing to the recovery of prices for this meat. "This, coupled with successive monthly records in beef and pork exports, keeps Brazilian animal proteins looking promising, especially as the end of the year approaches with the traditional increase in seasonal demand." He concludes by saying that the relative stability in the supply and prices of key inputs leaves the swine sector optimistic for the coming months.